

MetaCre8® ED – Engineering Design. A Method for Modernizing the R&D Toolchain.
Abstract
Engineering is based on a dense network of data that is interconnected in numerous and diverse ways across systems, disciplines, departments, and locations. R&D1Research and Development Division The tool chain, as the linchpin for product-related data, must be designed to provide the best possible support for development processes. To implement development strategies such as modular design and model-based systems engineering, the R&D tool chain must be adapted accordingly. To achieve this, structuring principles are needed to break down the complex overall task into manageable subproblems. With the MetaCre8® Engineering Framework A classification scheme is presented that structures data-related R&D artifacts and processes. To make the three-dimensional structure of the framework operationally applicable, the following is used: MetaCre8® ED – Engineering Design This white paper presents a method that enables cross-functional teams to map, analyze, and design the R&D tool chain using templates. Both perspectives—the framework and its operational application—are addressed in this white paper.
Introduction
As machines and systems become increasingly interconnected, the demands on the engineering landscape within companies are growing. Mechanical engineering, in particular, is characterized by a combination of predefined configurations (Configure-to-Order, CTO) and customer-specific development (Engineer-to-Order, ETO). Since the CTO portion dominates, the term CTO+ is also used, with the “+” symbolizing the relatively small ETO portion.
To further differentiate within the ETO portion, we can distinguish whether a requested custom solution has already been implemented in the past. If this is the case, we use the term CTO++ as long as the existing solutions have not yet been incorporated into the standard configuration.
Consequently, particularly in the machine tool industry, there are three types of order processing at the machine level: CTO, CTO+, and CTO++, with CTO and CTO+ differing significantly from one another. This process variability alone already leads to an inherently high level of process complexity. Due to the new opportunities and requirements arising from Industry 4.0, companies often consolidate their digitalization efforts into a new functional area. This, in turn, places additional internal demands on traditional development areas, particularly control technology. Against this backdrop, new technologies, systems, and components for establishing connectivity—such as OPC UA and edge devices—were introduced in the 2010s. While the complexity of development continues to rise due to the expanded range of functions, the way in which, such as is being developed in relatively small steps.
However, the development methodology and the system architecture go hand in hand with the product they represent. A simple system architecture can efficiently support only simple products and processes. For highly complex products and processes, on the other hand, a correspondingly high-performance system architecture with specific functions is required. Only by adapting the system architecture to the company, implementing product-related structures, institutionalizing processes, and empowering employees can the foundation for managing complexity be established. The new, stable operating point achieved through this process enables significantly reduced time-to-market, shorter delivery times, better products, and lower costs.
In addition to its direct impact on R&D efficiency, engineering can also be viewed as an enabler for future AI capabilities. This applies both to the machine as a product and to the company that develops and manufactures the machines. The basis for this is the use of structured development data to generate a semantic context—for example, for sensor data or components—that AI-based algorithms can process.
Investments in engineering are therefore of strategic importance in the medium and long term. Companies that have recognized this face the challenge of, such as they are expected to shape the transformation.
Currently, four key paradigms can be identified in engineering: The Modular Strategy, the Systems Engineering, the Digital Transformation2including AI and Agile. Companies must develop a transformation goal aligned with these dimensions. Since these areas are highly interdependent, they should be considered collectively. The modular strategy forms the basis for this and requires initial steps toward digital transformation. Key benefits include economies of scale and the elimination of redundant development work. Building on this, model-based systems engineering (MBSE) helps implement new functions in the shortest possible time by preventing errors and using automated processes—such as code generation—to significantly reduce programming effort. MBSE also requires corresponding steps toward digitalization. The modular approach and MBSE utilize standardized product and functional structures, architecture, and module interfaces. Only when complexity is managed through clear structures and supporting systems is a secure environment in place where it becomes easier to delegate control and avoid micromanagement. In such an environment, distributed teams can, in the spirit of Agile More responsibility will be delegated to employees, which can ease the burden on managers and unlock untapped potential.
The challenges of such a transformation are significant. As one of the most recent revolutionary changes in the industry, the introduction of lean production in the 1990s and 2000s can serve as a point of comparison. This fundamentally changed certain practices and mindsets that had been entrenched for decades—for example, through the shift to synchronized assembly lines, the production of small batches, and the massive reduction of safety stock between work steps. This transformation was actively driven by executive boards and involved all levels of production.3See Womack, J. P. and Jones, D. T. (2013).
An essential step in implementing lean production is the visual representation of the current state and the target state. Value stream mapping was developed for this purpose; it is used to analyze and design the flow of materials and information for a product throughout the value stream.4Rother, M. and Shook, J., (1999).
Just as value stream mapping supports the implementation of Lean, a graphical tool for interactive use in workshops is also essential for streamlining and realigning the R&D tool chain. The method presented in this white paper MetaCre8® ED – Engineering Design was developed for this purpose.
First, the underlying concept for structuring the engineering process is introduced, and the framework is presented.
Building on this, criteria for evaluating alternative solutions will be discussed.
Typical patterns in today's engineering landscapes are outlined and evaluated.
Next, the method MetaCre8® ED – Engineering Design presented in detail, followed by an outlook.
MetaCre8® Engineering Framework
Overview
The MetaCre8® Engineering Framework is a high-level model of the data-processing workflows in the R&D area, taking into account related functional areas.
The framework is a three-dimensional organizational schema that classifies the key interdisciplinary artifacts as well as the technical processes for processing these artifacts; see Figure 1.
The implementation of the framework within the company creates a shared mental model, which helps ensure that discussions are focused and reduces miscommunication. This, in particular, supports cross-functional and interdisciplinary collaboration.
The three dimensions of the framework are explained in more detail below.
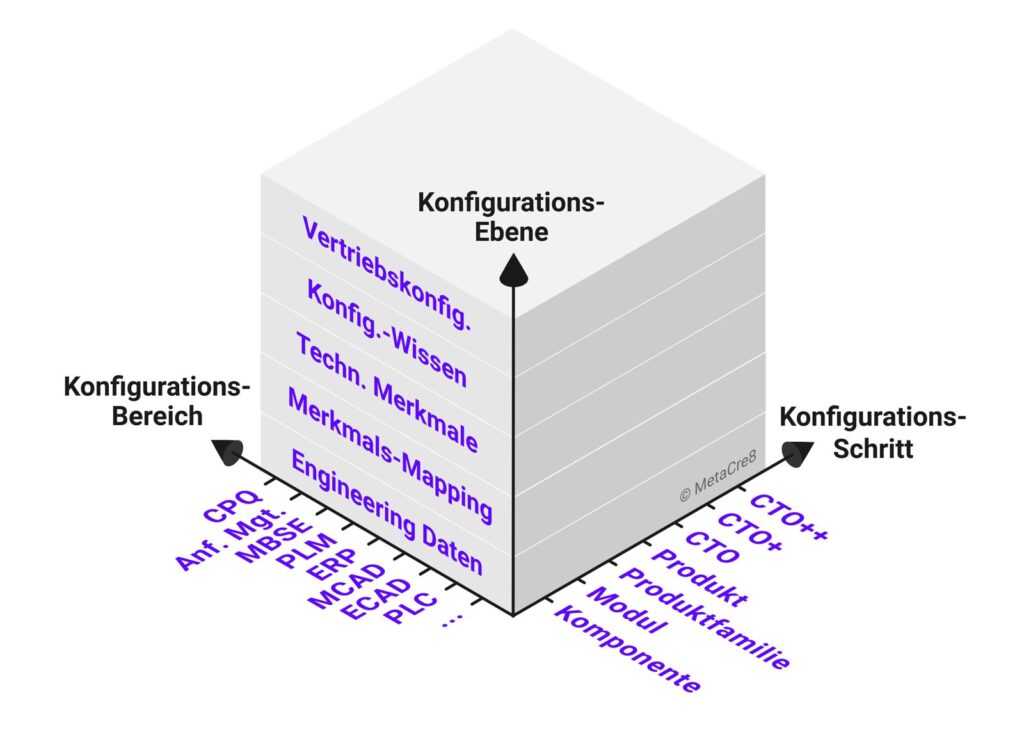
The „Configuration Area“ Axis“
The development of machinery and equipment involves numerous heterogeneous systems that specialize in specific areas of engineering. Whenever modular and/or highly variant product-related structures exist, they must be considered within the context of a modular structure. Conceptually, one walks through the development workflow, examining the tools used for CPQ, requirements management, MBSE, PLM, MCAD, ECAD, software development, simulation, testing, production, control parameterization, quality management, field data processing, etc. Topic areas and the tool or system categories used within them—in terms of engineering functions—are identified. These are plotted on the “Configuration Scope” axis.
The „Configuration Step“ Axis“
The Dimension Configuration Step structures the step-by-step development of modular structures. A distinction is made here between order-neutral and order-specific steps; see Table 1.
| Contents | Variance | A N5order-neutral | A S6job-specific | Explanation | Examples |
|---|---|---|---|---|---|
| Component | 100% | 150% | x | basic reusable units | ECAD Macros for Components Unique MCAD assemblies | |
| Module | 150% | x | Configurable components, typically at a level below the machine level; reusable; controlled lifecycle | ECAD subcircuit, PLC Function Block MCAD Main Physical Module | |
| Product Family | 150% | x | A collection of similar products based on a shared platform7See Meyer, M. H., Utterback, J. M. (1993), p. 30 | Major Projects (ECAD, Requirements Management, …) | |
| Product | 120% | x | Partial instantiation through the default values of product family attributes | Products visible to customers (e.g., single-spindle and double-spindle machines) | |
| CTO | 100% | x | Unambiguous evaluation of all configuration characteristics. Development is not involved. | ||
| CTO+ | (90+10new)% | x | Certain parts of the machine are customized to meet customer specifications. Basis: existing CTO configuration space | Custom-designed workpiece holders / clamping devices / automation / sensor systems / etc. | |
| CTO++ | (90+10 reps)% | x | Special requests can be addressed using past CTO+ developments that are not yet included in the standard (CTO). |
Order-Neutral Steps
Reusability and variability are crucial to the implementation of a modular strategy. Both aspects can occur at different levels of granularity: Granularity is divided into components, modules, product families, and products.
Examples of Components These are MCAD parts and assemblies or ECAD macros with value sets.
These components are used to create Modules, which represent larger physical or functional units, for which a module manager is generally responsible. These modules are managed by one or more Product Families used. A product family is defined here as the set of sufficiently similar Products considered, which are based on a common platform and can be effectively bundled from a development perspective8See Meyer, M. H., Utterback, J. M. (1993), p. 30. Examples of artifacts at the product family level include maximum-capacity projects for ECAD, automation projects for the PLC development environment, or the master part in MCAD.
The percentage notation here symbolizes the configuration space. 100% means no variance—or a unique characteristic value—that results in a fully defined value. 150% denotes a maximum structure that represents a defined configuration space through characteristics and characteristic values. 120% describes a partial configuration in which individual characteristics specific to the product have been assigned values.
During configuration, a distinction can still be made between additive and subtractive variant configuration. In additive variant configuration, a 100% variant is automatically assembled from fragments based on the assigned values of the characteristics. In subtractive variant configuration, a maximum structure is first defined. The elements that are not required are filtered out based on the characteristic values, resulting in a 100% variant.
A 120% structure or a 100% structure can thus be generated from a product family using either a subtractive or additive approach. The 120% structure is useful when products are internally differentiated—for example, into machine types based on format, features, or price segments—each of which provides its own entry point into the configuration process, yet all are based on a common architecture from a development perspective.
Order-Specific Steps
The distinction between order-neutral and order-specific elements is made using a conceptual dividing line. Order-specific elements include the order types CTO, CTO+, and CTO++. The latter refers to an ETO portion based on past orders that have not yet been transferred to the standard system.
The „Configuration Level“ Axis“
The Dimension Configuration Level describes how information regarding variant configuration flows between sales configuration and the engineering data associated with variants.
The sales configuration corresponds to the external variance, defined by a configuration space consisting of characteristics, characteristic values, and their possible combinations.
Similarly, describe Technical Specifications the within-group variance.
The Configuration Knowledge links the external variance with the internal variance, so that a technical solution can be automatically derived for a selected sales configuration.
The engineering and IT systems involved should provide capabilities for variant configuration (for example, in the form of configurators built into or integrated with the tools). The configuration parameters of these discipline-specific configurators must now be managed by a Attribute Mapping be linked to the respective technical specifications in order to trace the chain from sales all the way to the Engineering Data to close.
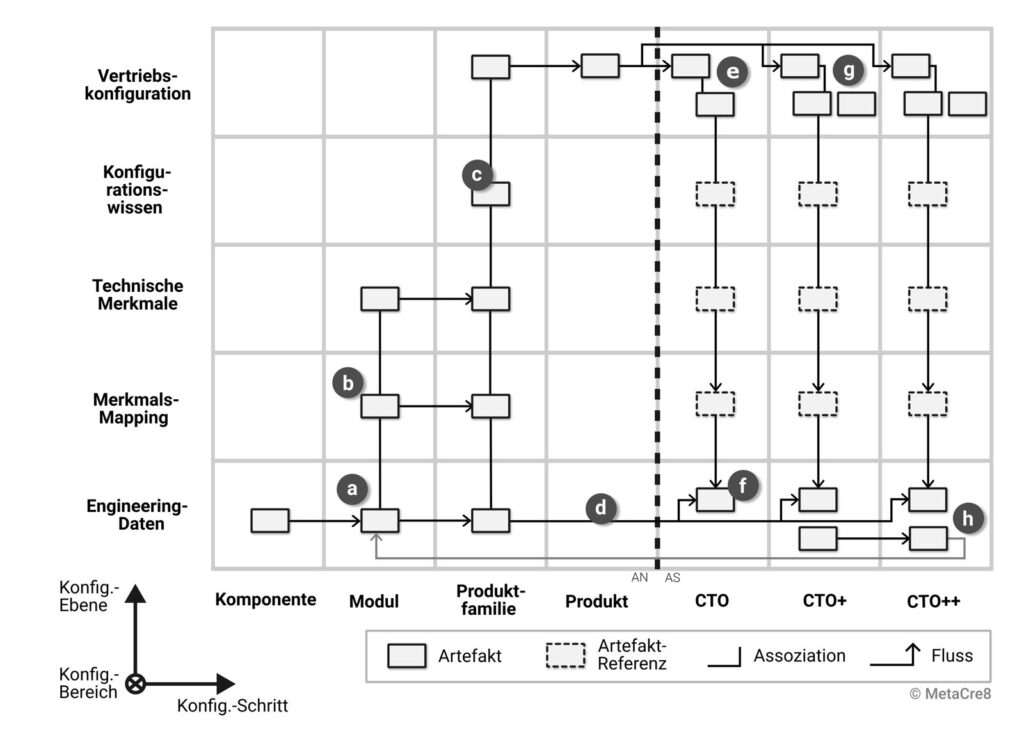
The interaction of the elements within the framework is illustrated in Figure 2. A modular component (a) is designed as part of one or more product families. During development, tool-internal or tool-related configurators are used to control the variance within the engineering data. For the configuration parameters, a mapping (b) to technical characteristics is defined, which is incorporated into an overall mapping for the product family. Similarly, the technical characteristics are grouped within the context of the product family and are thus available for defining the configuration knowledge (c). When an order is placed, the sales configuration from the predefined configuration space is used to fully define the product (e). Based on the configuration knowledge and the mapping, the engineering data is retrieved in the correct variant (f). In the case of CTO+, a specification is additionally attached because the predefined configuration space does not fully cover the customer requirements (g). At the engineering data level, adjustments must then be made, for example, based on the best-fit configuration. In the case of CTO++, these adjustments can be reused from past CTO+ orders (h).
The Basic Elements
Elements arranged within the framework include nodes and edges between two nodes. The nodes represent any artifacts in engineering, while the edges represent processes that depict the transition from one artifact to another or a general relationship between artifacts.
Node
Examples of artifacts include mechanical assemblies (MCAD), macros (ECAD), function blocks (PLC), submodels (OPC UA), bills of materials (BOM), projects (PLC Engineering), characteristic valuations (sales order), etc.
In this context, artifacts are regarded as general information technology structures. Similarly, documents and files—which serve as carriers of information—are also considered artifacts.
Artifacts can be copied or exported as part of the configuration. Artifacts can also be assembled from other artifacts.
In widely distributed structures, artifact references can be used to describe the relationship to other existing artifacts. In some situations, the use of references improves readability (e.g., when describing order-specific processes that access elements from order-neutral areas).
Artifacts can also be nested within one another to improve clarity or to represent hierarchical relationships, such as the project file and the structures it contains.
Edges
Edges are divided into flows and associations. For a rough overview of the engineering tool chain, these two categories are sufficient for now. Flows symbolize a temporal process, such as the assembly of projects from modules or the export and import of exchange files. Associations, on the other hand, represent more static relationships, the formation process of which plays a secondary role in engineering analysis. If necessary, the process can be described in detail in design guidelines. Examples of associations include the edges between a feature and its instance, between an ERP material and a work plan, between a PLC data block and an OPC UA submodel, and between an MCAD assembly and a master model.
Criteria for Evaluating Alternative Solutions
Because the functional scopes of tool vendors sometimes overlap, there is an immensely large range of possible solutions for the future toolchain. It is therefore important to identify fundamental design patterns to accelerate the decision-making process. For these patterns—as well as for decisions on a case-by-case basis—an evaluation framework that is as objective as possible is required. Table 2 provides a list of the categories “costs” and “employee satisfaction” for this purpose. Engineering and IT tools must adequately support users’ natural workflow. If this is not the case—for example, due to long loading times, a lack of automation, or a heavy division of labor that relies on administrators or key users—frustration arises, and innovative potential cannot be fully realized. Particularly with complex tasks such as setting up and testing variants in engineering systems, a long response time can lead to significant losses in mental efficiency because the flow of thought is interrupted by the artificial wait time.9See Miller, 1968, p. 268
Category | Details |
|---|---|
Costs |
|
Costs |
|
Employee Satisfaction |
|
Examples of Architectural Patterns
In the following, alternative architectural patterns are compared as extreme examples. In practice, hybrid forms are often encountered.
Discipline-Specific Configurators vs. Centralized Configuration Knowledge
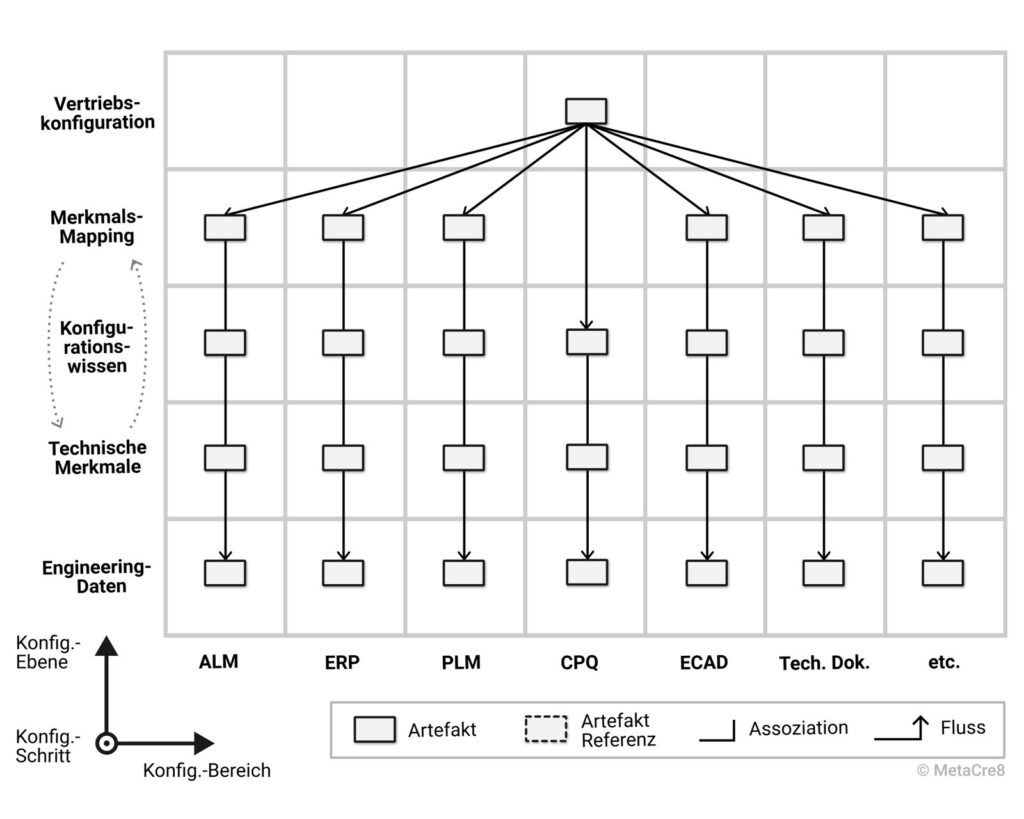
Due to the increasing expansion of product portfolios at many mechanical engineering companies and the lack of an overarching configuration strategy, individual departments or groups have each implemented discipline-specific configuration solutions. This has often resulted in highly complex configuration silos that—when viewed holistically—contain a large amount of redundant configuration knowledge. One example is the variant configuration of manufacturing bills of materials in the ERP system. The configuration rules required for this are sometimes implemented by different people in different systems—for parameterizing the control software, configuring circuit diagram documentation, and configuring technical documentation.
For example, the sales configuration with its valued characteristics is used as the lowest common denominator; see Figure 3. The mapping takes place at the sales parameter level, followed by redundant configuration knowledge.
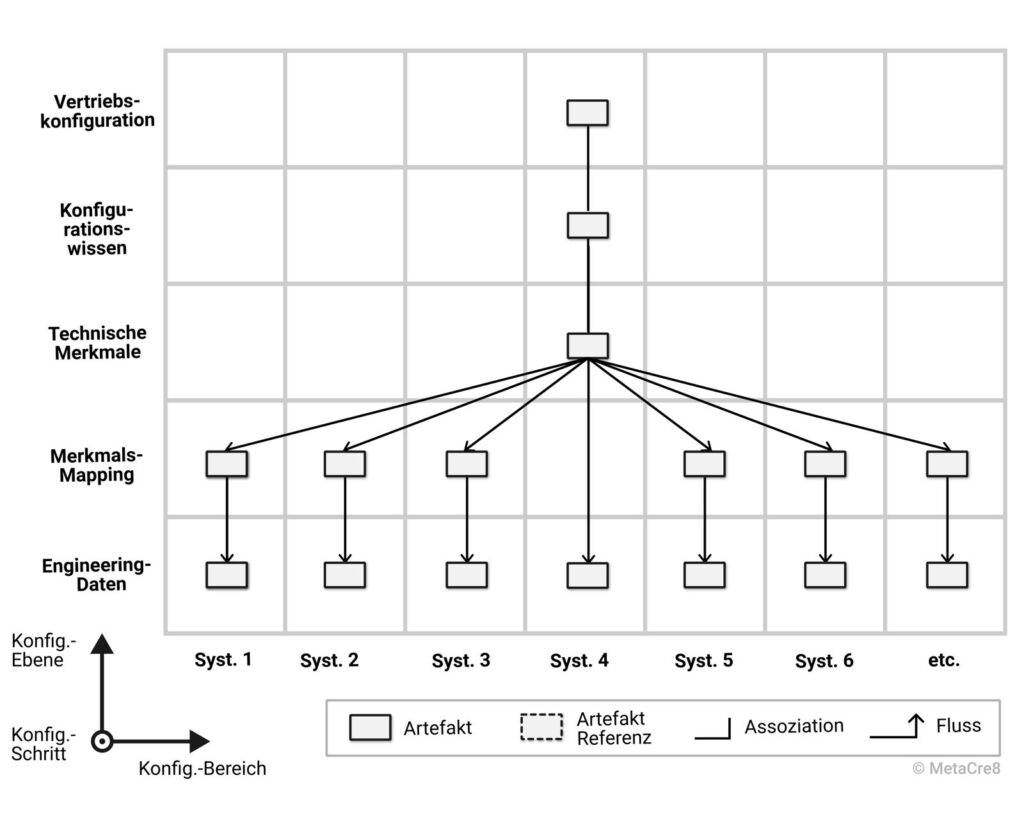
Alternatively, companies can opt for a single system to handle in-depth configuration knowledge (such as an ERP system, a CPQ system, or another system); see Figure 4. This system links sales attributes and technical attributes through a set of rules. The technical attributes are then mapped to the configuration attributes of the respective discipline—for example, to control variants and options in electrical design. The mapping can be stored in a file or a suitable data source. During order generation, this data source is then used together with the values of the technical attributes (plus selected sales attributes) to generate the specific format of the ECAD-specific configuration switches. The generated data structure is then used to automatically set the required attribute values in the ECAD product family project. This process occurs in parallel across multiple disciplines (e.g., ERP). For different scenarios (CTO, CTO+), a greater or lesser number of configuration areas may be involved. For example, in the CTO scenario, the ECAD documents, MBOMs, and work plans are configured, but not the MCAD or development BOMs, because no order-specific changes are made to the product in the CTO scenario.
Evaluation of the Approaches
Due to the high level of specialization and complexity, it is significantly more time-consuming to establish staff redundancy in Approach 1. If redundancy is lacking, outages can lead to dangerous bottlenecks. Furthermore, the large amount of redundant data creates significant potential for errors due to inconsistencies, as it is difficult to consistently keep all configuration data updated simultaneously. This hinders the rapid and stable implementation of changes, which negatively impacts time-to-market. Complex configurators lead to a high degree of division of labor between administrators and users. As a result, an understanding of variance is not sufficiently cultivated, making it difficult to expect users across the board to handle variance independently. Yet it is precisely this organizational competence that is required to successfully roll out a modular strategy and avoid bottlenecks.
Approach 2 centralizes configuration knowledge without redundancy. In this approach, configurators are also used at the data level within the business departments. However, the 150% modules to be designed are structured such that the characteristics describe only the technical solution space without restrictions. This approach has two key advantages. First, it enables developers to manage variant configuration themselves (e.g., as module owners). This avoids bottlenecks and allows developers to work more independently. They identify with the modular strategy and take personal responsibility. At the same time, flexibility in the use of the modules increases when configuration rules are first applied at the level Configuration Knowledge be defined within the respective product family. For simple, decentralized configurators, licensing costs are also generally lower than for systems used to manage complex configuration rules.
Group Bill of Materials vs. Product Structure/EBOM/MBOM
The product structure is the hierarchical breakdown of a product into a tree-like structure10Svensson, D. and Malmqvist, J. (2000), p. 2. The term "product structure" can therefore be used in the broadest sense to define the hierarchical organization and system boundaries of a product. In a narrower sense, it describes data structures in the PLM environment that represent this breakdown.
The general product structure serves specific purposes that vary depending on the area. Design has different requirements for the product structure than production does. A division into views or separate structures is therefore a logical approach, but it requires system-level and organizational measures to ensure data consistency.
To overcome the obstacles to addressing this challenge, many small and medium-sized businesses opt for a shared structure as a compromise.
With regard to bills of materials, this means that Engineering and Production use the same bill of materials, which is managed by the Development department. Production now has read-only access. The Development department carries out structural adjustments as a service for Production.
Figure 5 shows a greatly simplified version of this concept. The MCAD and PLM configuration areas are shown on the left as examples. The PLM area is viewed here as a lean intermediate layer, similar to a PDM system. Design engineers maintain the master BOM (c), which is used by production in read-only mode. Components are referenced by modules, and modules are ultimately referenced by products (d). Production creates the plant-specific maximum work plans. When an order is placed, these are activated to manufacture the product (e).
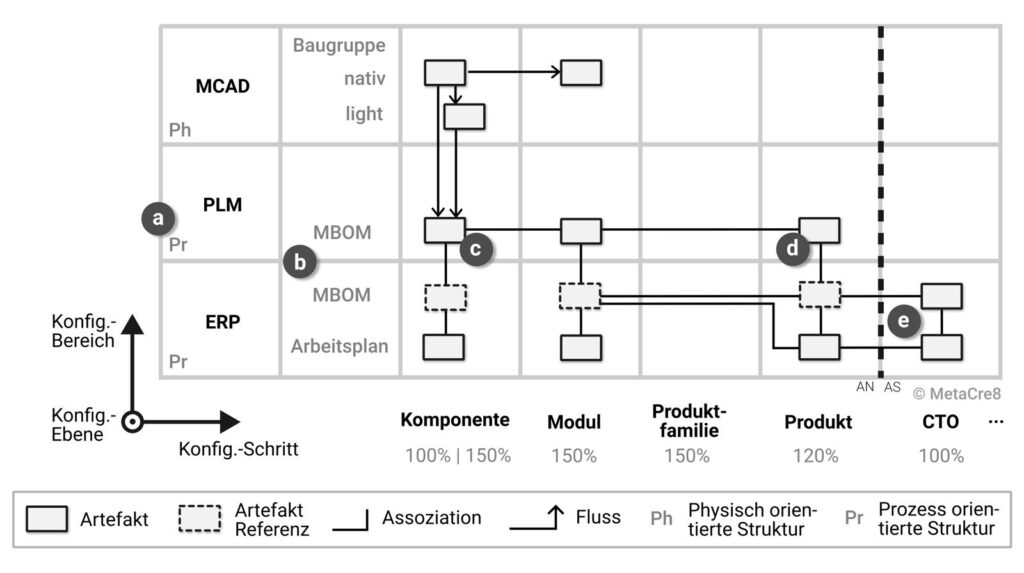
The structures used in each case are indicated by abbreviations on the left (a). Ph refers to the purely physical structure11The term „functional assembly“ is deliberately avoided to prevent confusion with the functional structure., Pr The process-oriented structure. The master BOM must adhere to production requirements in terms of its hierarchical structure. The conflict between engineering and production becomes very clear. Either consistency between MCAD and ERP materials is lost, or the engineer must structure the assemblies in accordance with production logistics.
As an alternative to the corporate bill of materials, the bill of materials structures in EBOM and MBOM can be decoupled. Figure 6 illustrates this concept in a highly simplified manner in connection with a product structure.
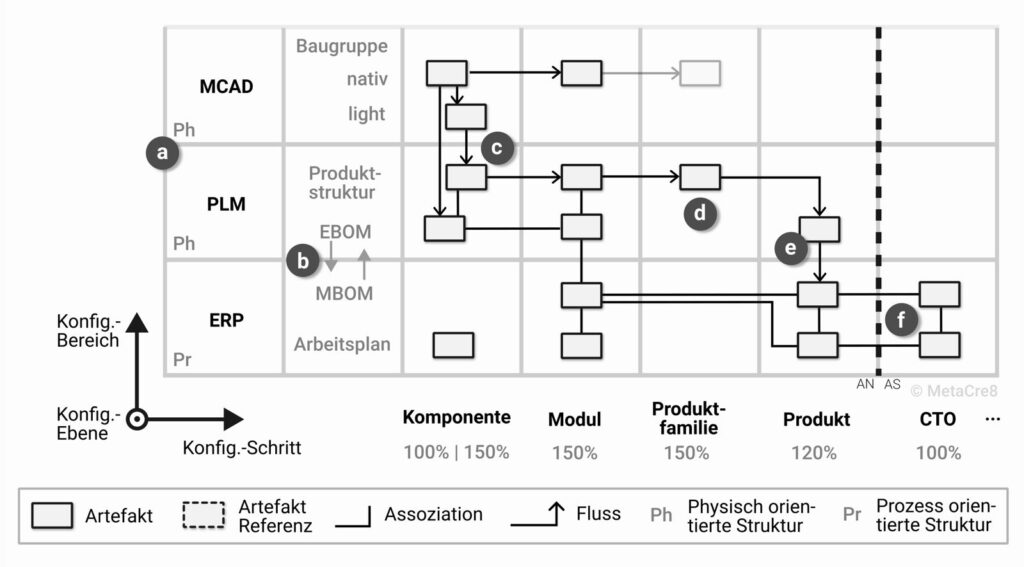
In the configuration sections MCAD and PLM In this process, the product is structured consistently according to development criteria. During the transition from PLM to ERP, the data is translated into an assembly-optimized MBOM (b). From an IT perspective, this translation step can be performed either in the PLM or in the ERP system. In addition to material numbers, the product structure can also reference lightweight MCAD data. The spatial position is calculated using transformation matrices (c). The product structure of a submodule, for example, is defined as a top-level structure consisting of unique assemblies. The product structure node at the module level is composed of these submodules. The module’s structure node, in turn, is incorporated into the product structure under the “Product Family” column (d). From there, synchronization into a 120% EBOM begins, for example (e). This is then converted by production into a 120% MBOM, whereby production-related restructuring is possible.
There are numerous variations on this concept, particularly with regard to CTO+ and CTO++. Due to the high level of complexity resulting from process variability combined with the various systems involved, a careful analysis and evaluation of alternative architectures for the R&D toolchain is essential.
Evaluation of the Approaches
In principle, separating EBOMs and MBOMs leads to greater efficiency and satisfaction within the various departments, because each department can work with the structures that are optimal for it, while still ensuring that changes are implemented in a controlled manner. Production can implement process optimizations without requiring the development department to regularly adjust the bill of materials structure. In addition, the timing of changes can be controlled with fine granularity for each plant.
However, these advantages come with increased system complexity and the need for additional specialized tools. In addition, the scope of responsibilities for production and work planning is expanded to include tasks such as restructuring bills of materials and synchronizing changes from the EBOMs to the MBOMs. This requires building up the necessary capacity—including backup resources—as well as developing expertise through training and guidelines.
300% Projects vs. Reuse of Modules
In 300% structures, multiple products within individual configuration ranges are combined into a single master project that extends beyond the scope of a single product family.
The reason for this usually lies in insufficient modularization and/or a lack of system support. Without separate, independent management of modules, redundant data inevitably arises when a module is used by two product families. In this case, the module’s data must be copied from one project to the other if the module is managed only in the 150% project. To prevent this, some administrators choose to merge the product families. However, eliminating redundancy comes at the cost of a significant increase in complexity. Furthermore, consistent release management becomes more difficult because merging the projects requires separate versioning and approval, which involves increased effort. Testing such large-scale projects is time-consuming. The overall management of 300% projects is cumbersome, and the learning curve is very steep. Furthermore, this creates a single point of failure.
Ideally, product families with a uniform scope should be created across all disciplines, and that the tools be extended (if necessary, through add-ons) to enable separate module management with 150% structures, which also supports the reuse of modules across different product families.
MetaCre8® ED – Engineering Design
MetaCre8® ED Template
A three-dimensional process model is unsuitable for practical use. However, to preserve the nature of the framework, the dimension Configuration Level projected obliquely onto the 2D plane and compressed. This results in a 2D template that can be populated with specific artifacts and process lines; see Figure 7.
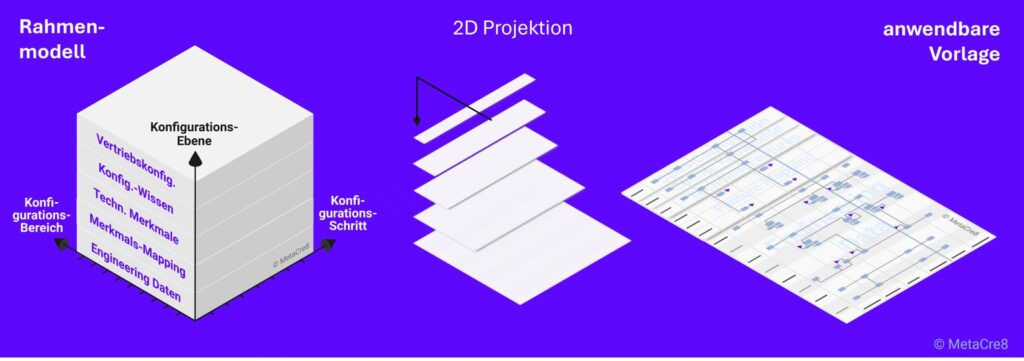
Fields
Depending on the company or its focus, the fields on the axis may Configuration Section distinguish. This part can therefore be customized. On the "Scope of Analysis" axis, the steps are Product, CTO+ and CTO++ Optional.
In the case of open modular systems, such as manufacturing systems, CTO can also be understood as an additive combination of configurable CTO products. When there is a large volume of customer-specific developments, CTO should be replaced by ETO.
The fields for mapping and configuration knowledge are further subdivided during modeling, depending on how many configurators with their own configuration knowledge or how many mappings are in use.
MetaCre8® ED Plans
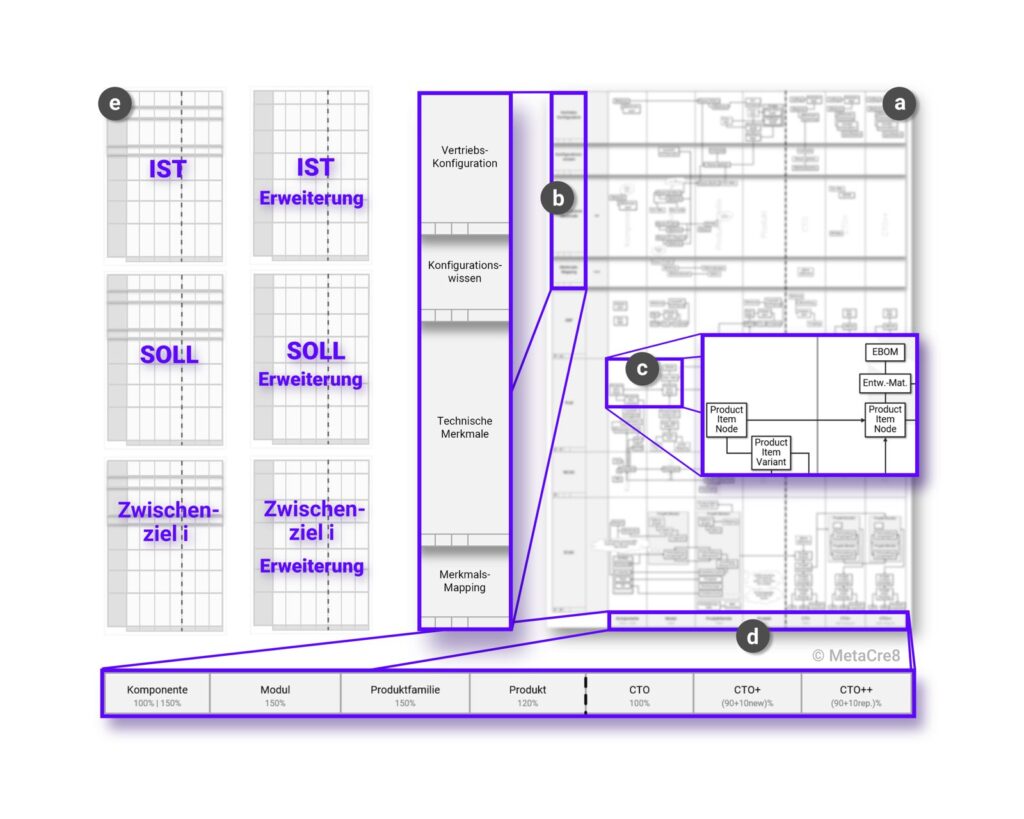
A result of working with MetaCre8® ED is shown in Figure 8. The MetaCre8® The ED Template (a) contains fields for the configuration levels (b) in the upper section and fields for the engineering data (c) below them. Both sections span the configuration steps (d).
MetaCre8 are created through the interactive process of filling out the template as a team® ED plans for the current situation, the target situation, and intermediate goals (e). Expansion plans allow for the flexible integration of additional configuration areas.
Outlook
Digitalization, systems engineering, modular strategies, and agile methodologies have the potential to significantly transform companies’ competitiveness. Connectivity in the context of Industry 4.0 and the implementation of industrial AI are increasingly giving rise to new, additional functional requirements for machine development.
For decades, companies in the mechanical engineering industry have incrementally refined their R&D toolchain and methods. A leader in product innovation, but a laggard in process innovation, —this is how one might describe the mindset of many companies in the mechanical and plant engineering sector. What is often overlooked is that IT-related product innovations increasingly require a modern R&D toolchain. Those who invest in engineering today will be able to (efficiently) deploy industrial AI in the future. This is because automated data processing—and autonomous decision-making in particular—requires clear structures and semantic context to ensure deterministic response behavior and to enable direct data mapping.
The modernization of engineering only takes full effect after a transition period. New methods are most effectively introduced through new products. Therefore, it can take years for the existing product portfolio to be completely replaced by products based on a modernized R&D toolchain and new product structuring. With every additional machine launched today based on outdated, suboptimal structures, the machine manufacturer loses years toward completing the transformation.
If industrial AI is viewed as an opportunity for high-wage countries like Germany to maintain production, development, and thus industrial jobs in the future, then in the areas of development today the groundwork is laid for this.
Sources
Meyer, M. H. and Utterback, J. M. (1993) „The Product Family and the Dynamics of Core Capability,“, Sloan Management Review, 34(3), pp. 29–47.
Miller, R. B. (1968). Response time in human-computer conversational interactions. Proceedings of the AFIPS Fall Joint Computer Conference Vol. 33, 267–277.
Rother, M., and Shook, J. (1999). Learning to See: Value Stream Mapping to Create Value and Eliminate Muda. Version 1.2. Brookline, MA: Lean Enterprise Institute.
Svensson, D. and Malmqvist, J. (2000). „Strategies for Product Structure Management in Manufacturing Firms,“ in Proceedings of the 2000 ASME Design Engineering Technical Conferences (DETC2000), Baltimore, Maryland, USA, September 10–14, 2000.
Womack, J. P. and Jones, D. T. (2013): Lean Thinking: Cut Out the Fat, Boost Corporate Profits, 3rd, updated and expanded edition, Frankfurt am Main: Campus Verlag.
Citation Format
To cite this article in term papers, research papers, or publications, please use the following citation:
Karlberger, A. (2026): „MetaCre8”® ED – Engineering Design. A Method for Modernizing the R&D Toolchain.“ In: MetaCre8 GmbH Technical Blog. Published on November 3, 2026. Current version: 1.0. URL: https://metacre8.com/metacre8-ed-engineering-design-eine-methode-zur-modernisierung-der-fe-tool-chain (Accessed on: [DD.MM.YYYY]).
Version History & Changelog
| Version | Date | Contents |
| 1.0 | 03.11.2026 | Initial publication of the white paper |